← All products · Step 4 · Check

MachinePulse 360
Probe results on the control as they are measured, judged against the tolerance set in Fusion.
▶ The 1-minute overview · captions, so it works with the sound off
← All products · Step 4 · Check
Probe results on the control as they are measured, judged against the tolerance set in Fusion.
▶ The 1-minute overview · captions, so it works with the sound off
MachinePulse 360
The usual way to find out a prototype is wrong is to take it off the machine, walk it to the CMM, and lose the setup. MachinePulse 360 runs on the Okuma control and pushes every probe result out the instant it is measured — so a feature can be checked between toolpaths, while the part is still clamped and still correctable.
It is live telemetry off the P500: one stream out of the control feeds the results page on the machine and the shop dashboard at the same time, in real time. Every reading is judged against the tolerance band you set on that feature in Fusion — the real one, carried through the post into the NC program, not a generic default. And it doesn't only report where a feature is: it watches where each one is heading, and says so before the part that would have been scrap.
Where the numbers come from
1 · Fusion
Inspect Surface points and Renishaw probing cycles, with the tolerance you set on the feature.
2 · Post
The SP post carries each feature's name, operation and tolerance into the NC program.
3 · Machine
The probe measures. The result is published on the control the same second.
4 · Decide
In print → keep cutting. Out of print → the row goes red and the program can stop so you re-machine now.
5 · Report
Every measurement is logged and becomes the full inspection report at M30.
No extra hardware and no second probe: it uses the Renishaw probe, the Fusion inspect toolpaths and the post you already run. MachinePulse 360 only reads the control — it never commands machine motion.
Three signals, on every measured feature
Green · In print
The deviation sits inside the tolerance band set on that feature in Fusion. The band is the applied one, carried through the post into the program — so a pass means it passed your print, not a generic default.
Red · Out of tolerance
Outside the band, so the feature does not pass. It turns red on the control's results page and on the dashboard the moment it is measured — while the part is still clamped, still indicated, still fixable. The program can be set to stop right there instead of cutting the next operation into a part that is already scrap.
Yellow · Predicted out
A dashed yellow line projects each feature forward from the parts already measured. When a real trend is there — thermal growth, tool wear, an offset walking — it says how many parts until that feature goes out of print, so you touch the offset before you make the bad one. Where the scatter doesn't support a trend it says no trend detected rather than drawing a confident line through noise.
Green and red are measurements. Yellow is a prediction, and it is drawn dashed, in its own colour, with the uncertainty around it — so a forecast can never be mistaken for something the probe actually touched.
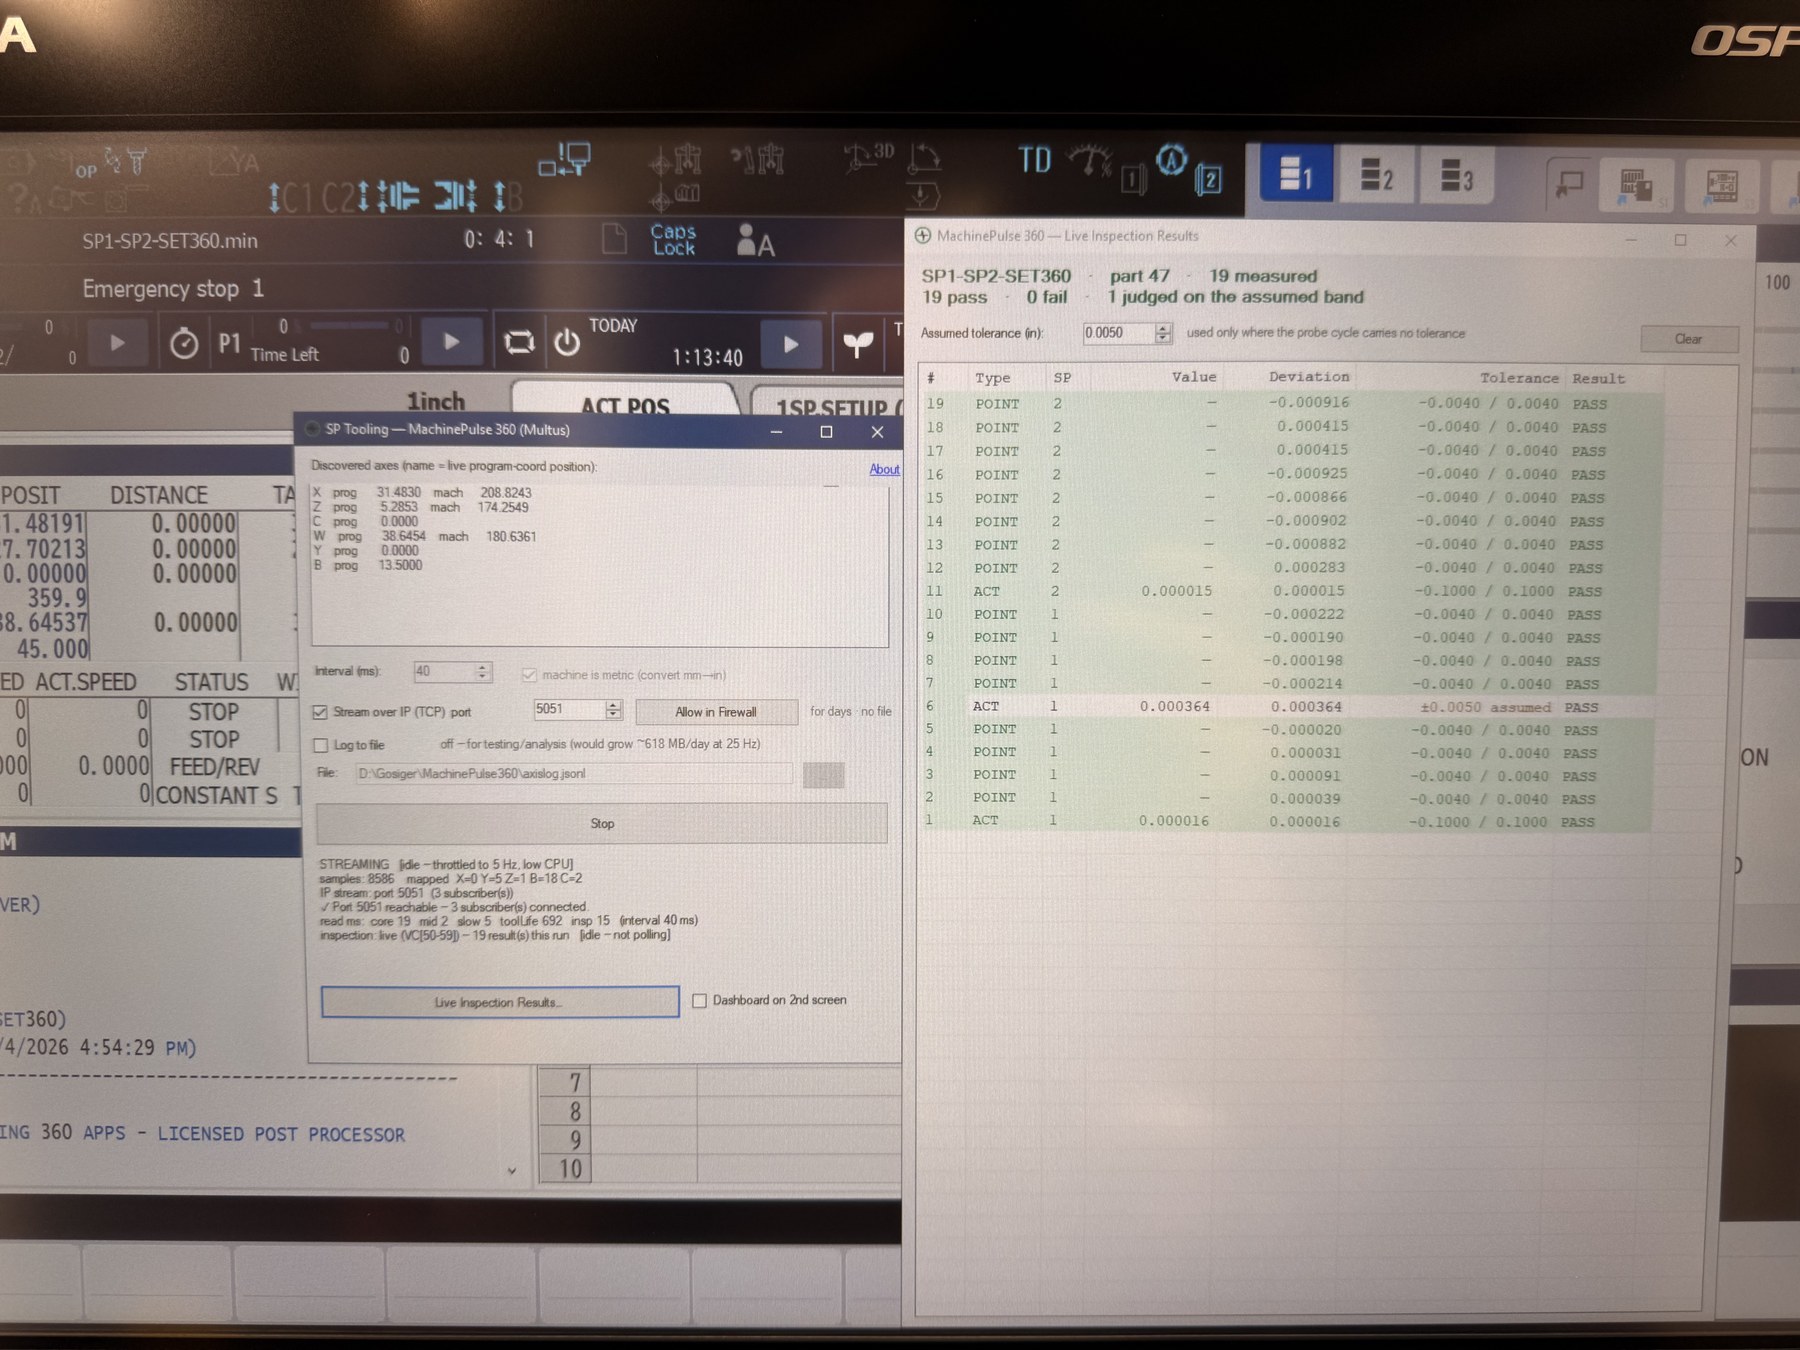
This is the whole OSP-P500 screen during a real job — the machine's own control, not a PC beside it. SP1-SP2-SET360, part 47, 19 features measured, 19 pass, 0 fail, main and sub spindle both covered. Nothing left the machine to produce this: MachinePulse 360 reads each probe result out of the control as it is written and puts it straight on the operator's screen, right next to the running program. The one row judged against the assumed band is called out by name rather than being quietly mixed in with the real tolerances.
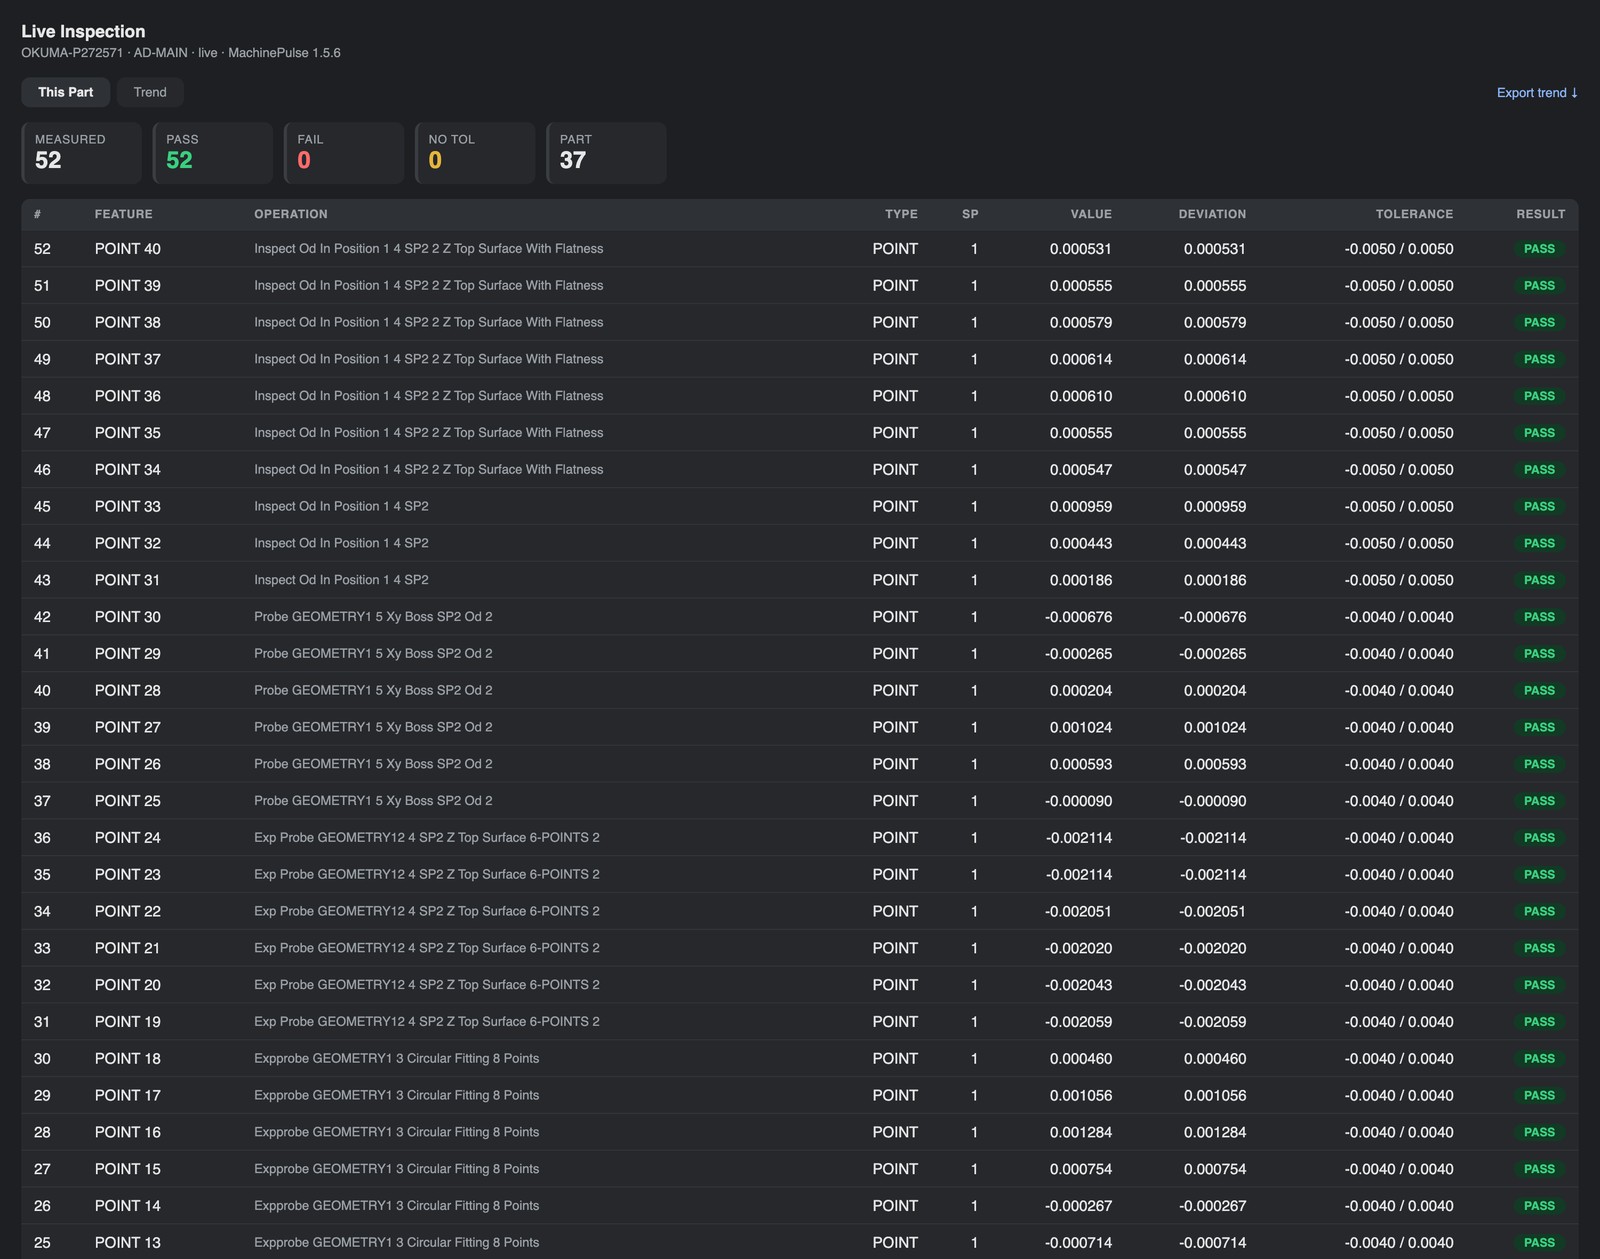
A real run: 52 features on part 37, each row landing as the probe touches off. Feature name, the Fusion operation it came from, measured value, deviation, the tolerance band and a pass / fail call — live, while the part is still in the machine. Surface-inspection points carry the tolerance straight from Fusion; Renishaw cycle results are shown against a stated default band and labelled as such, so an assumed number never reads like a real one.
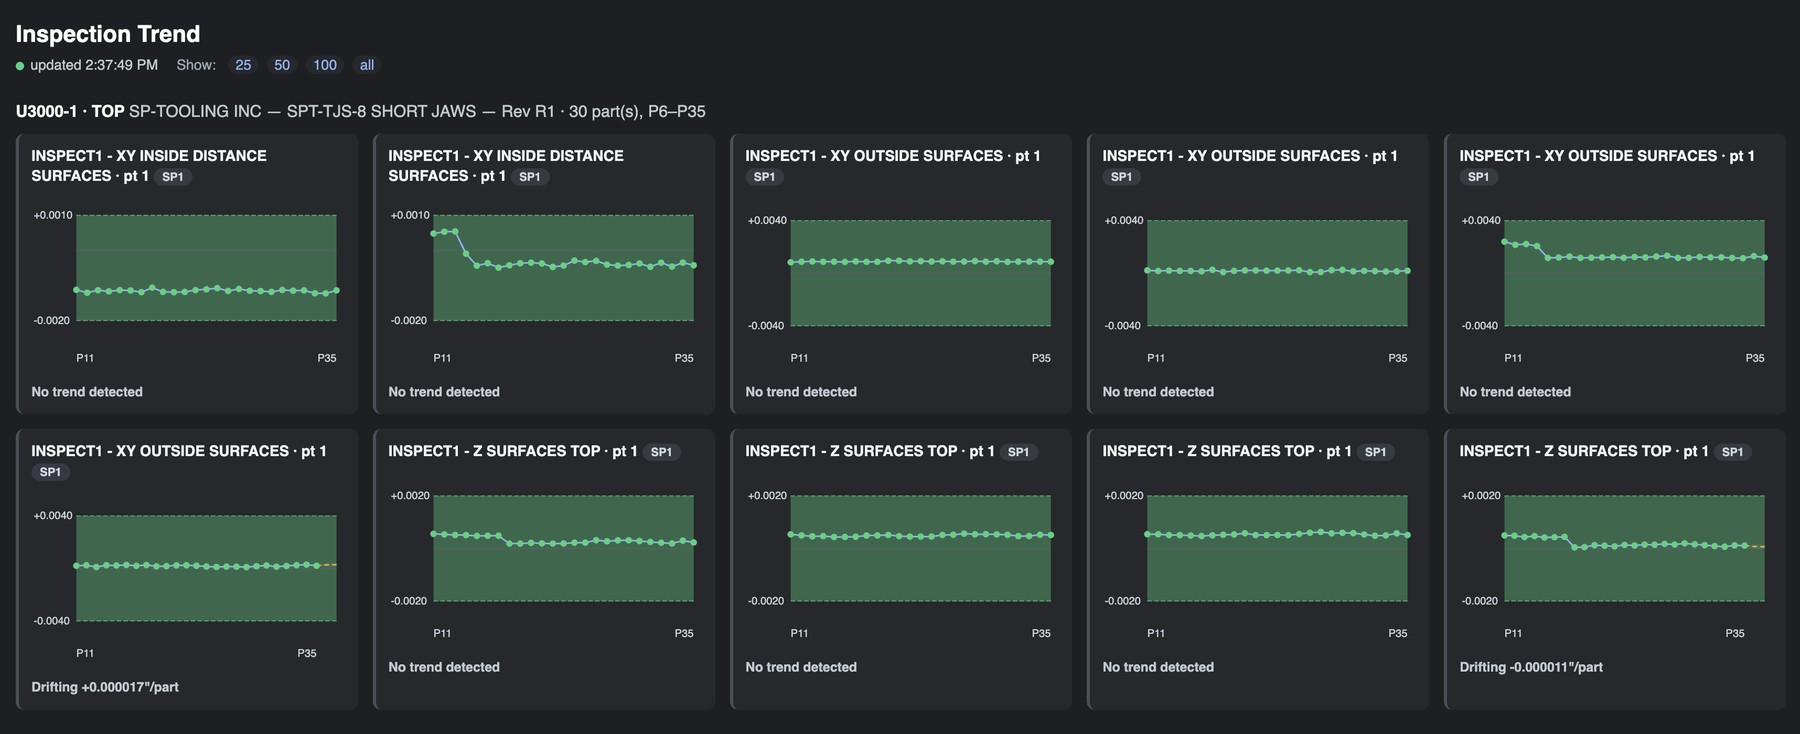
A live job, not a demo: SPT-TJS-8 short jaws, 30 parts, P6 through P35, one card per inspected feature. Each chart plots that feature's measured deviation part by part inside its own band — note they differ (+0.0010/-0.0020, ±0.0040, ±0.0020), because each one is the tolerance set on that feature in Fusion, not a blanket number. Eight features report no trend detected; two are quietly drifting, at +0.000017″ and -0.000011″ per part. That is the whole point — the drift is called out while it is still four zeros deep, not when it reaches the print.
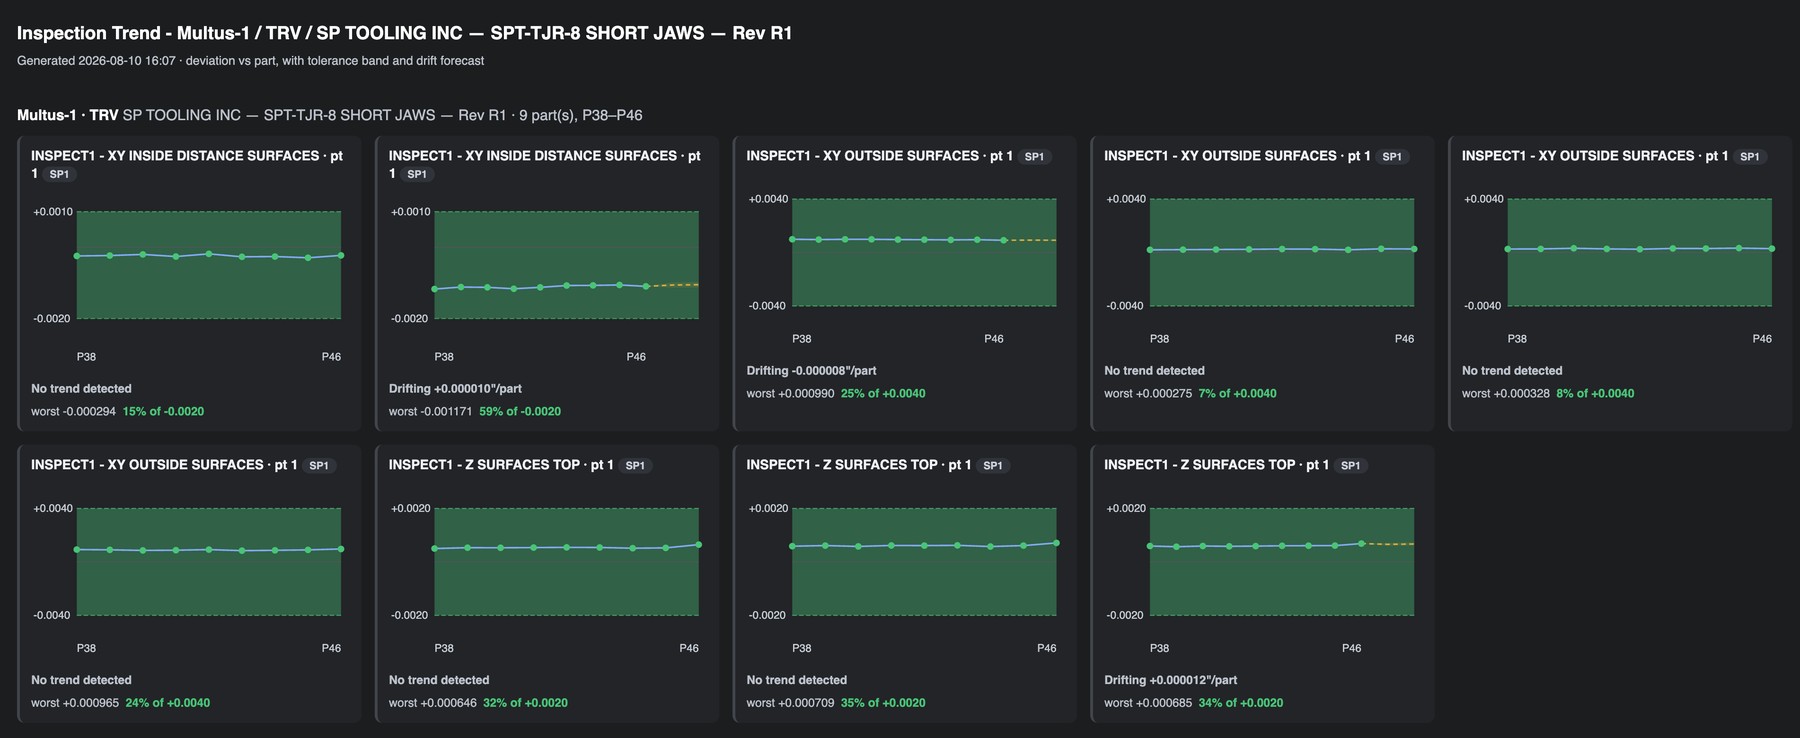
The same run read as a report. Every card says how much of its tolerance the worst part actually used — 7%, 15%, 24%, 59% — so a feature quietly eating its band stands out long before anything fails. Where a feature is genuinely drifting, the fit is projected forward as the dashed yellow line past the last measured part, with the drift called out (+0.000010″/part here). Where the scatter doesn't support a trend it says no trend detected instead of drawing a line through noise.
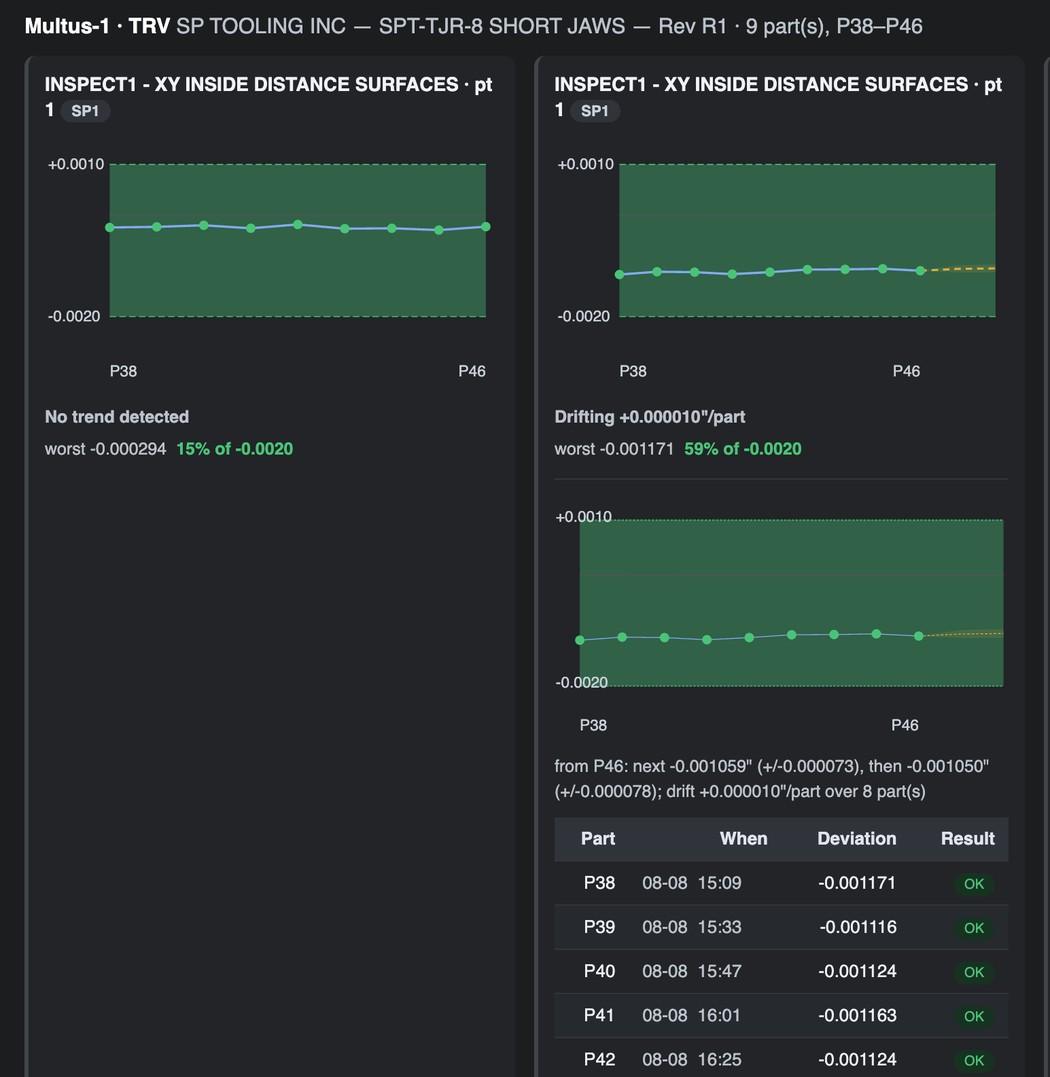
Click a feature and it shows its work. This one is drifting +0.000010″ per part, and rather than just saying so it commits to a number: “from P46: next -0.001059″ (±0.000073), then -0.001050″ (±0.000078)” — the prediction and the uncertainty on it, so you can judge for yourself whether it is worth touching an offset. Underneath sits the audit trail: every part measured, when it ran, what it deviated, whether it passed.
The tolerances MachinePulse 360 judges against are the ones you set on the Inspect Surface points in Fusion — the same results also come back onto the 3D model once the part is done.
The Renishaw probe going in on a part that is still clamped, between operations, on a live job. Every one of these touches is a number on the dashboard the moment it happens — and a line in the inspection report at the end of the part.
Part 47, from the first touch. The counter climbs 1, 3, 5, 7, 9 and a row lands each time the probe touches off — live, with the part still in the chuck. Every row carries the Fusion operation it came from and its own band: ±0.0020 on the Z surfaces, ±0.0040 on the XY outside surfaces, -0.0020/+0.0010 on the inside distance. At the end it flips to the Trend tab, where the part has already joined the run history. Nothing was exported and nothing waited for M30. (Sped up 3× — the real part takes about a minute of probing.)
Both screens run off the same live stream, but they answer different questions. At the machine, the operator gets numbers and a green / red call — on the control itself, with nothing to set up and nothing else to go wrong. Off the machine, the shop dashboard adds the feature and operation names read from the posted program, the cross-part trends, and the yellow forecast. The screen that has to keep running stays the simple one.
See It In Action · 3 min
Live Inspection on the Okuma Multus — Fusion to the OSP-P500 and back, with measured results landing on the model while the part is still clamped
Get in touch for pricing, a demo, or to talk shop. Built by machinists — happy to talk machinist.
Thanks, we have your request. We will email you to set up a time.