← All products · Step 3 · Make

VC Variable Manager
Maps every VC variable your programs use against what is live on the control, before a macro overwrites one.
▶ The 40-second overview · captions, so it works with the sound off
← All products · Step 3 · Make
Maps every VC variable your programs use against what is live on the control, before a macro overwrites one.
▶ The 40-second overview · captions, so it works with the sound off
See It In Action
Point it at your MD1 drive and it scans every program to map which VC variables your code uses, reads every live-registered variable off the machine, and heatmaps both. Switch between values, program usage, or a combined view to see at a glance what's still free — and where to be careful, since a running program could write to an address on the fly.
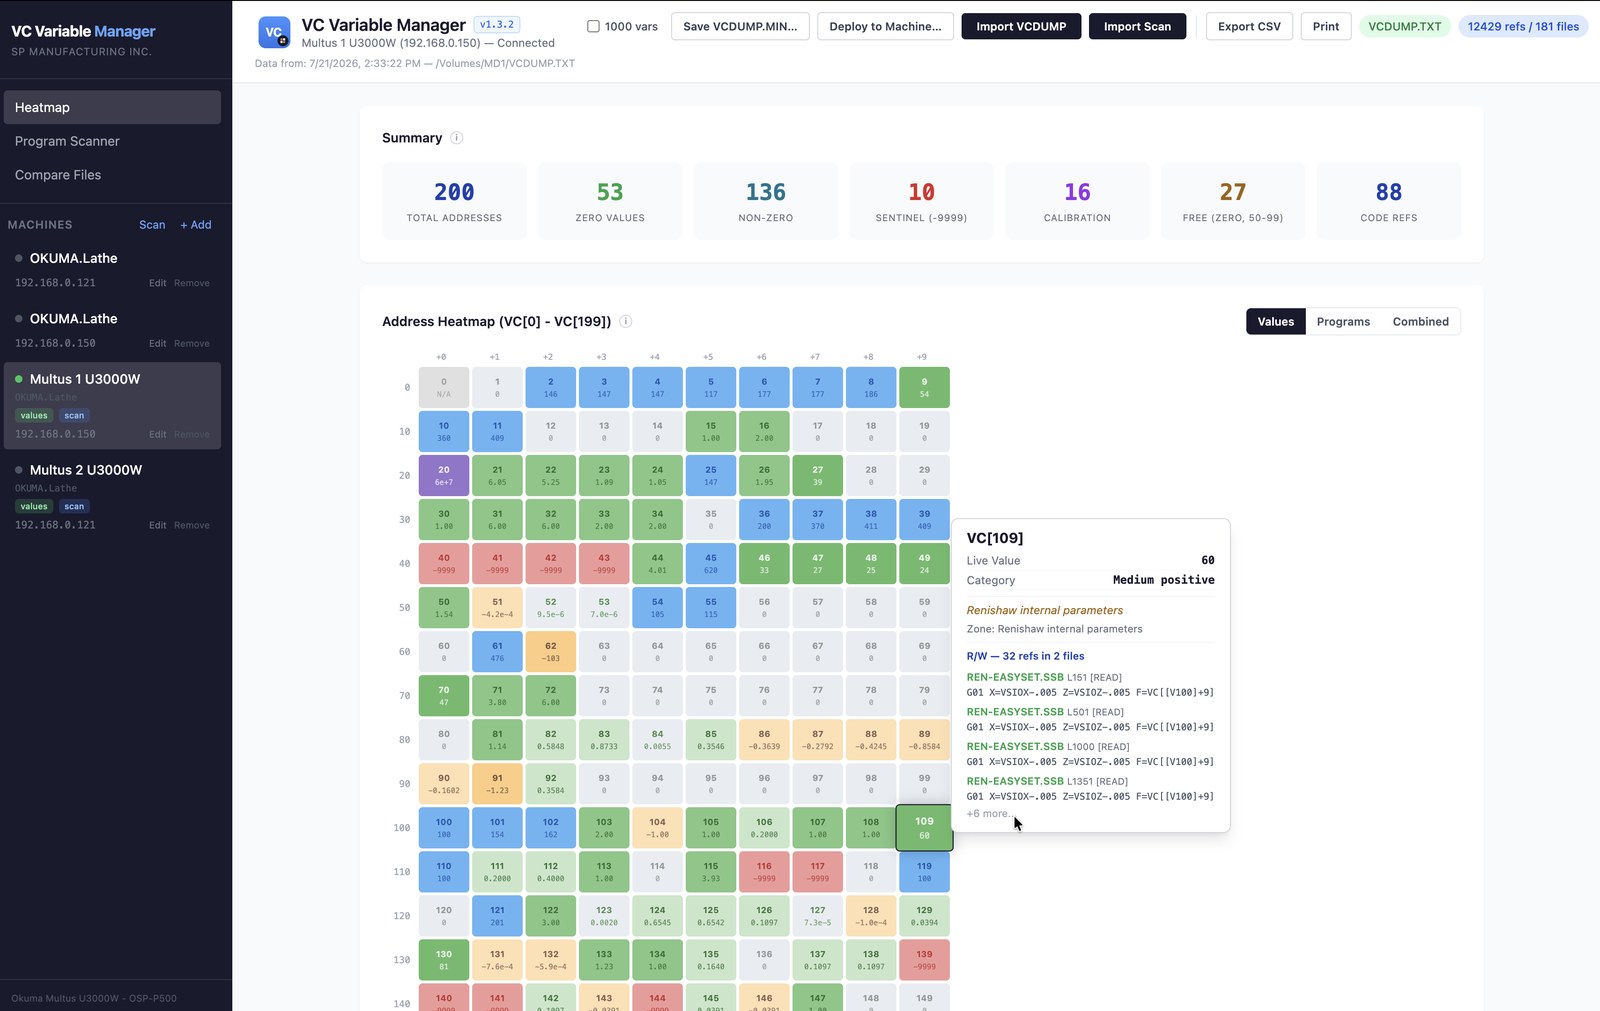
Every VC address (VC[0]–VC[199]+) color-coded by value and category. Hover any cell for its live value, zone — Renishaw, calibration, inspection — read/write status, and the exact code lines that reference it. Summary bar tallies zeros, non-zeros, sentinels, calibration, and free addresses at a glance.
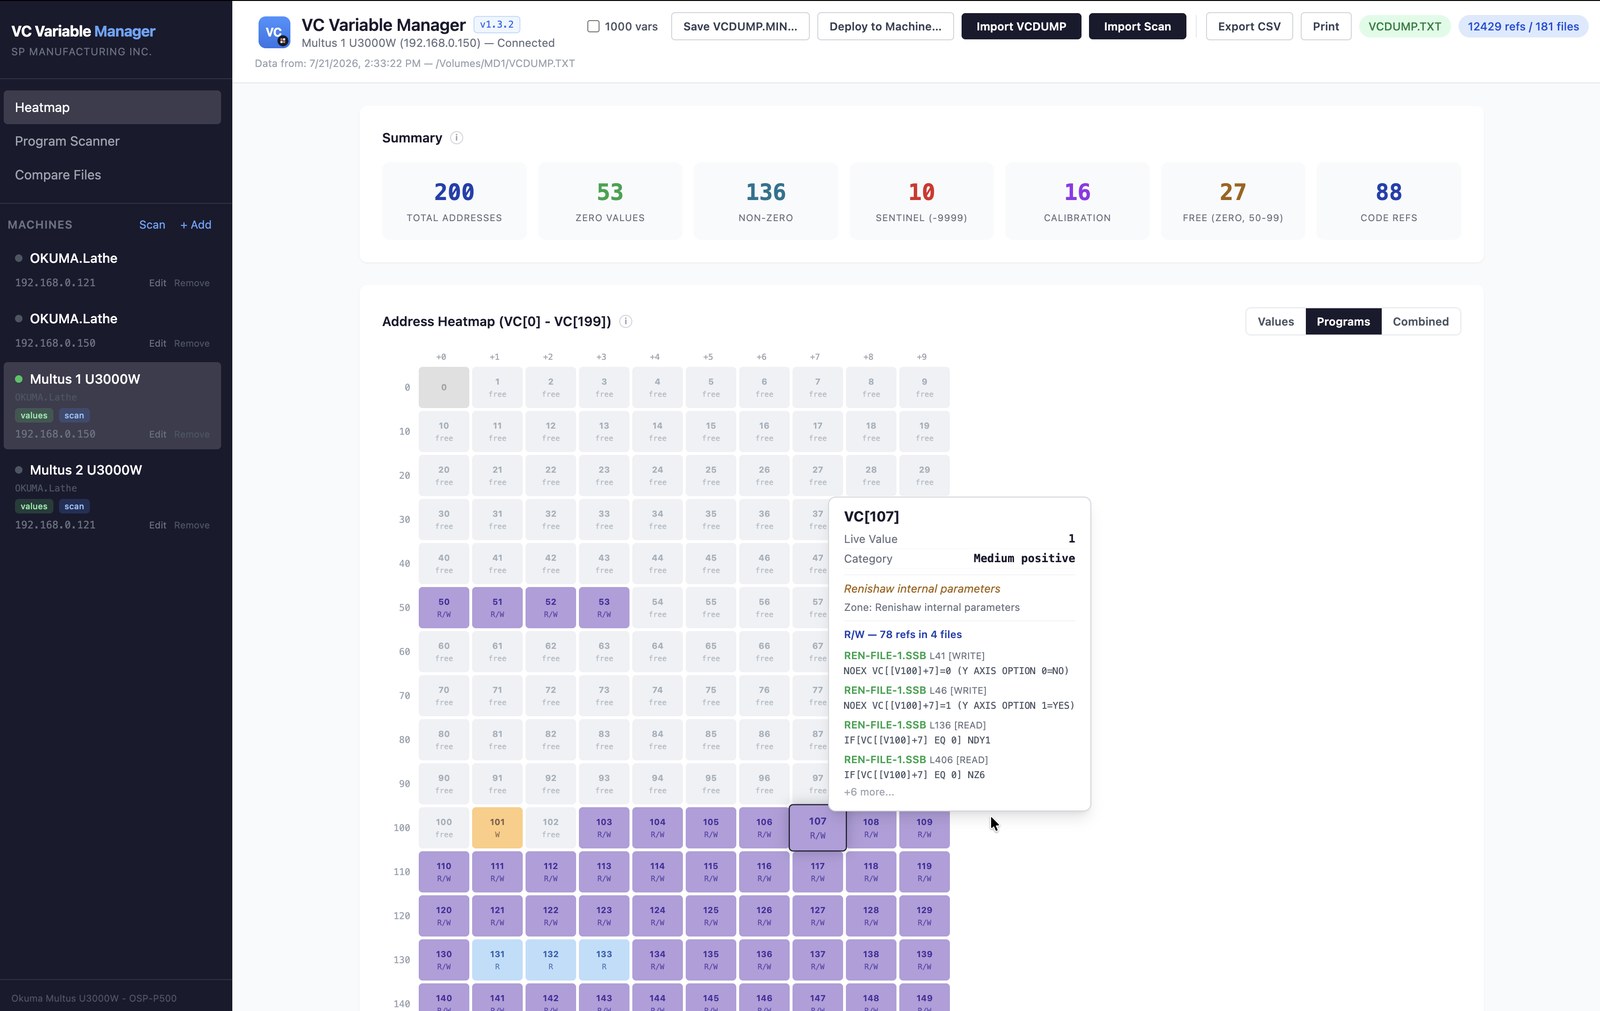
Toggle between live values and program usage — see at a glance which addresses your code leans on hardest and which are untouched.
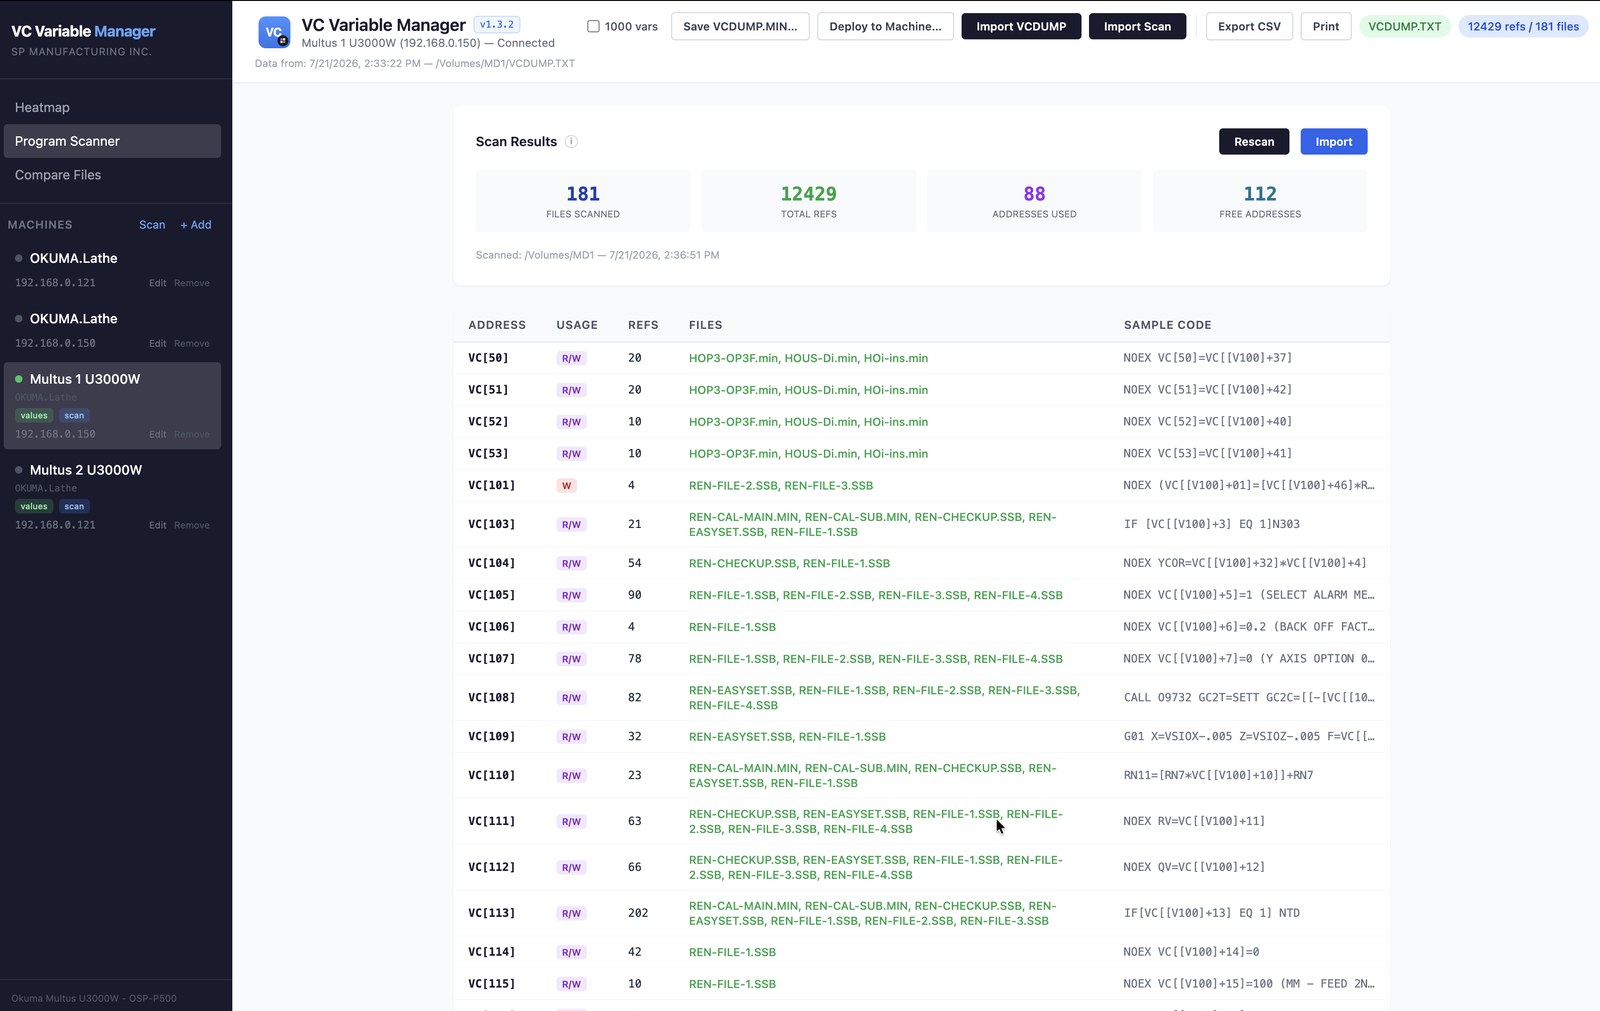
Scan your whole program folder — 181 files, 12,429 references — for a table of every VC address used: how (read/write), how many times, in which files, with sample code.
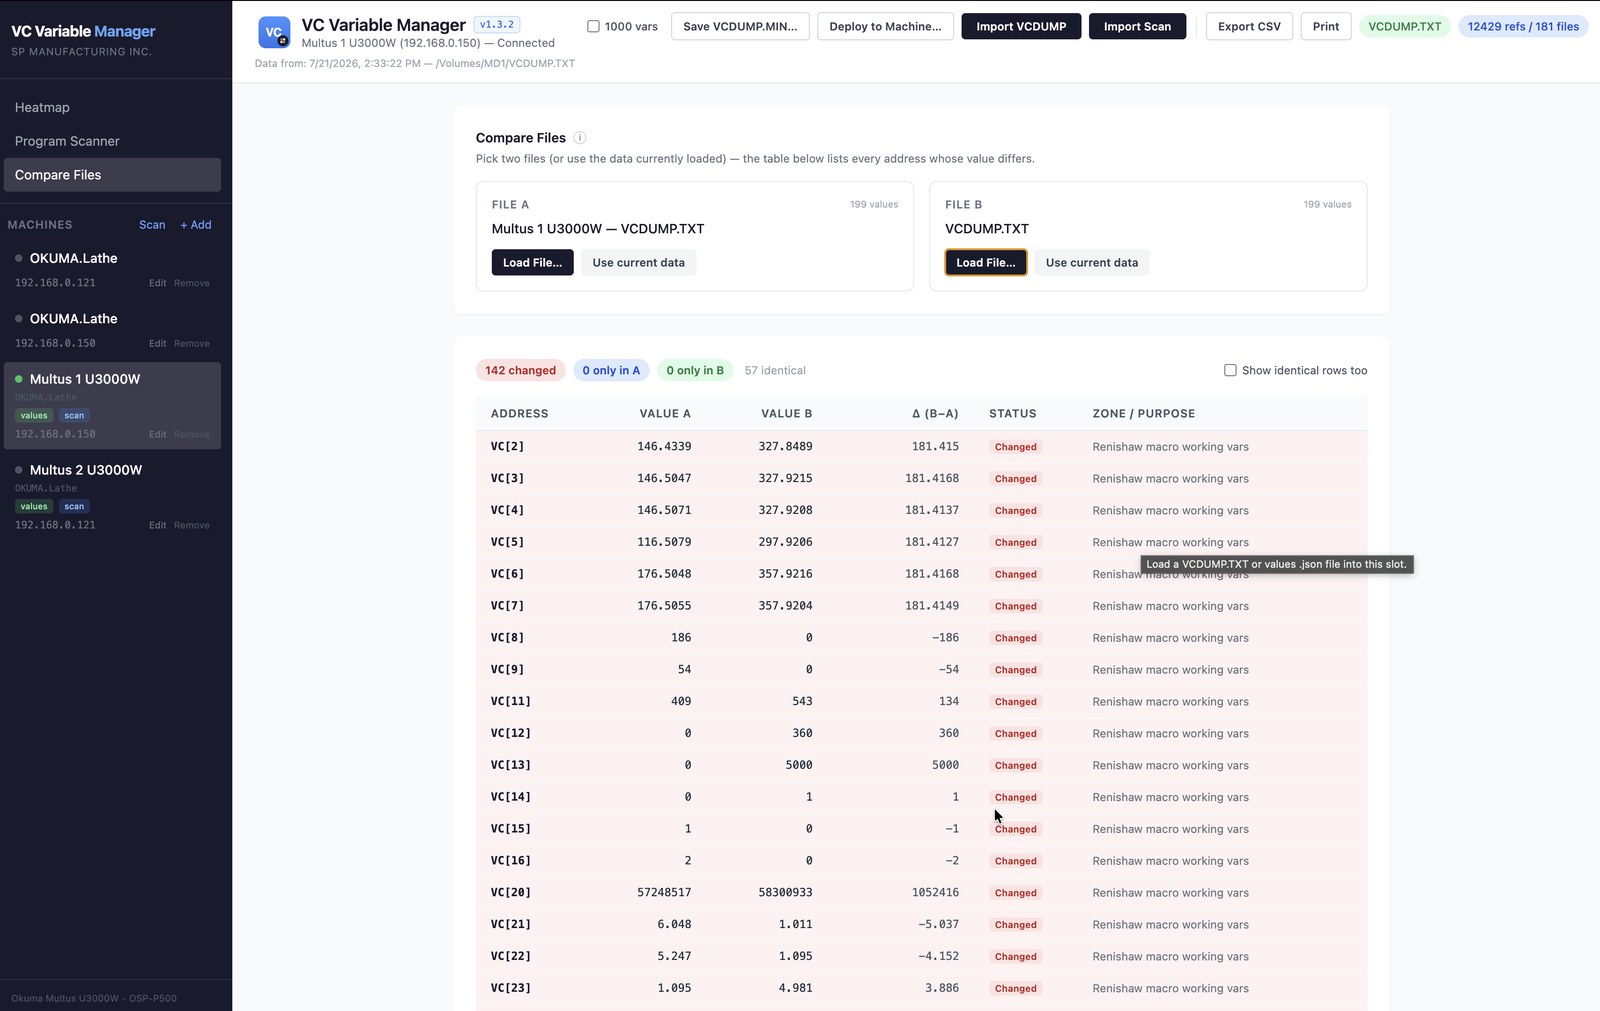
Diff two VCDUMP files or machine states side by side — every address whose value differs, with the delta and its zone — so you can see exactly what changed between machines or over time.
Get in touch for pricing, a demo, or to talk shop. Built by machinists — happy to talk machinist.
Thanks, we have your request. We will email you to set up a time.